
The one with the data
Client: Personal . Data Visualisation
Long-listed at the Kantar Information is Beautiful Awards 2019
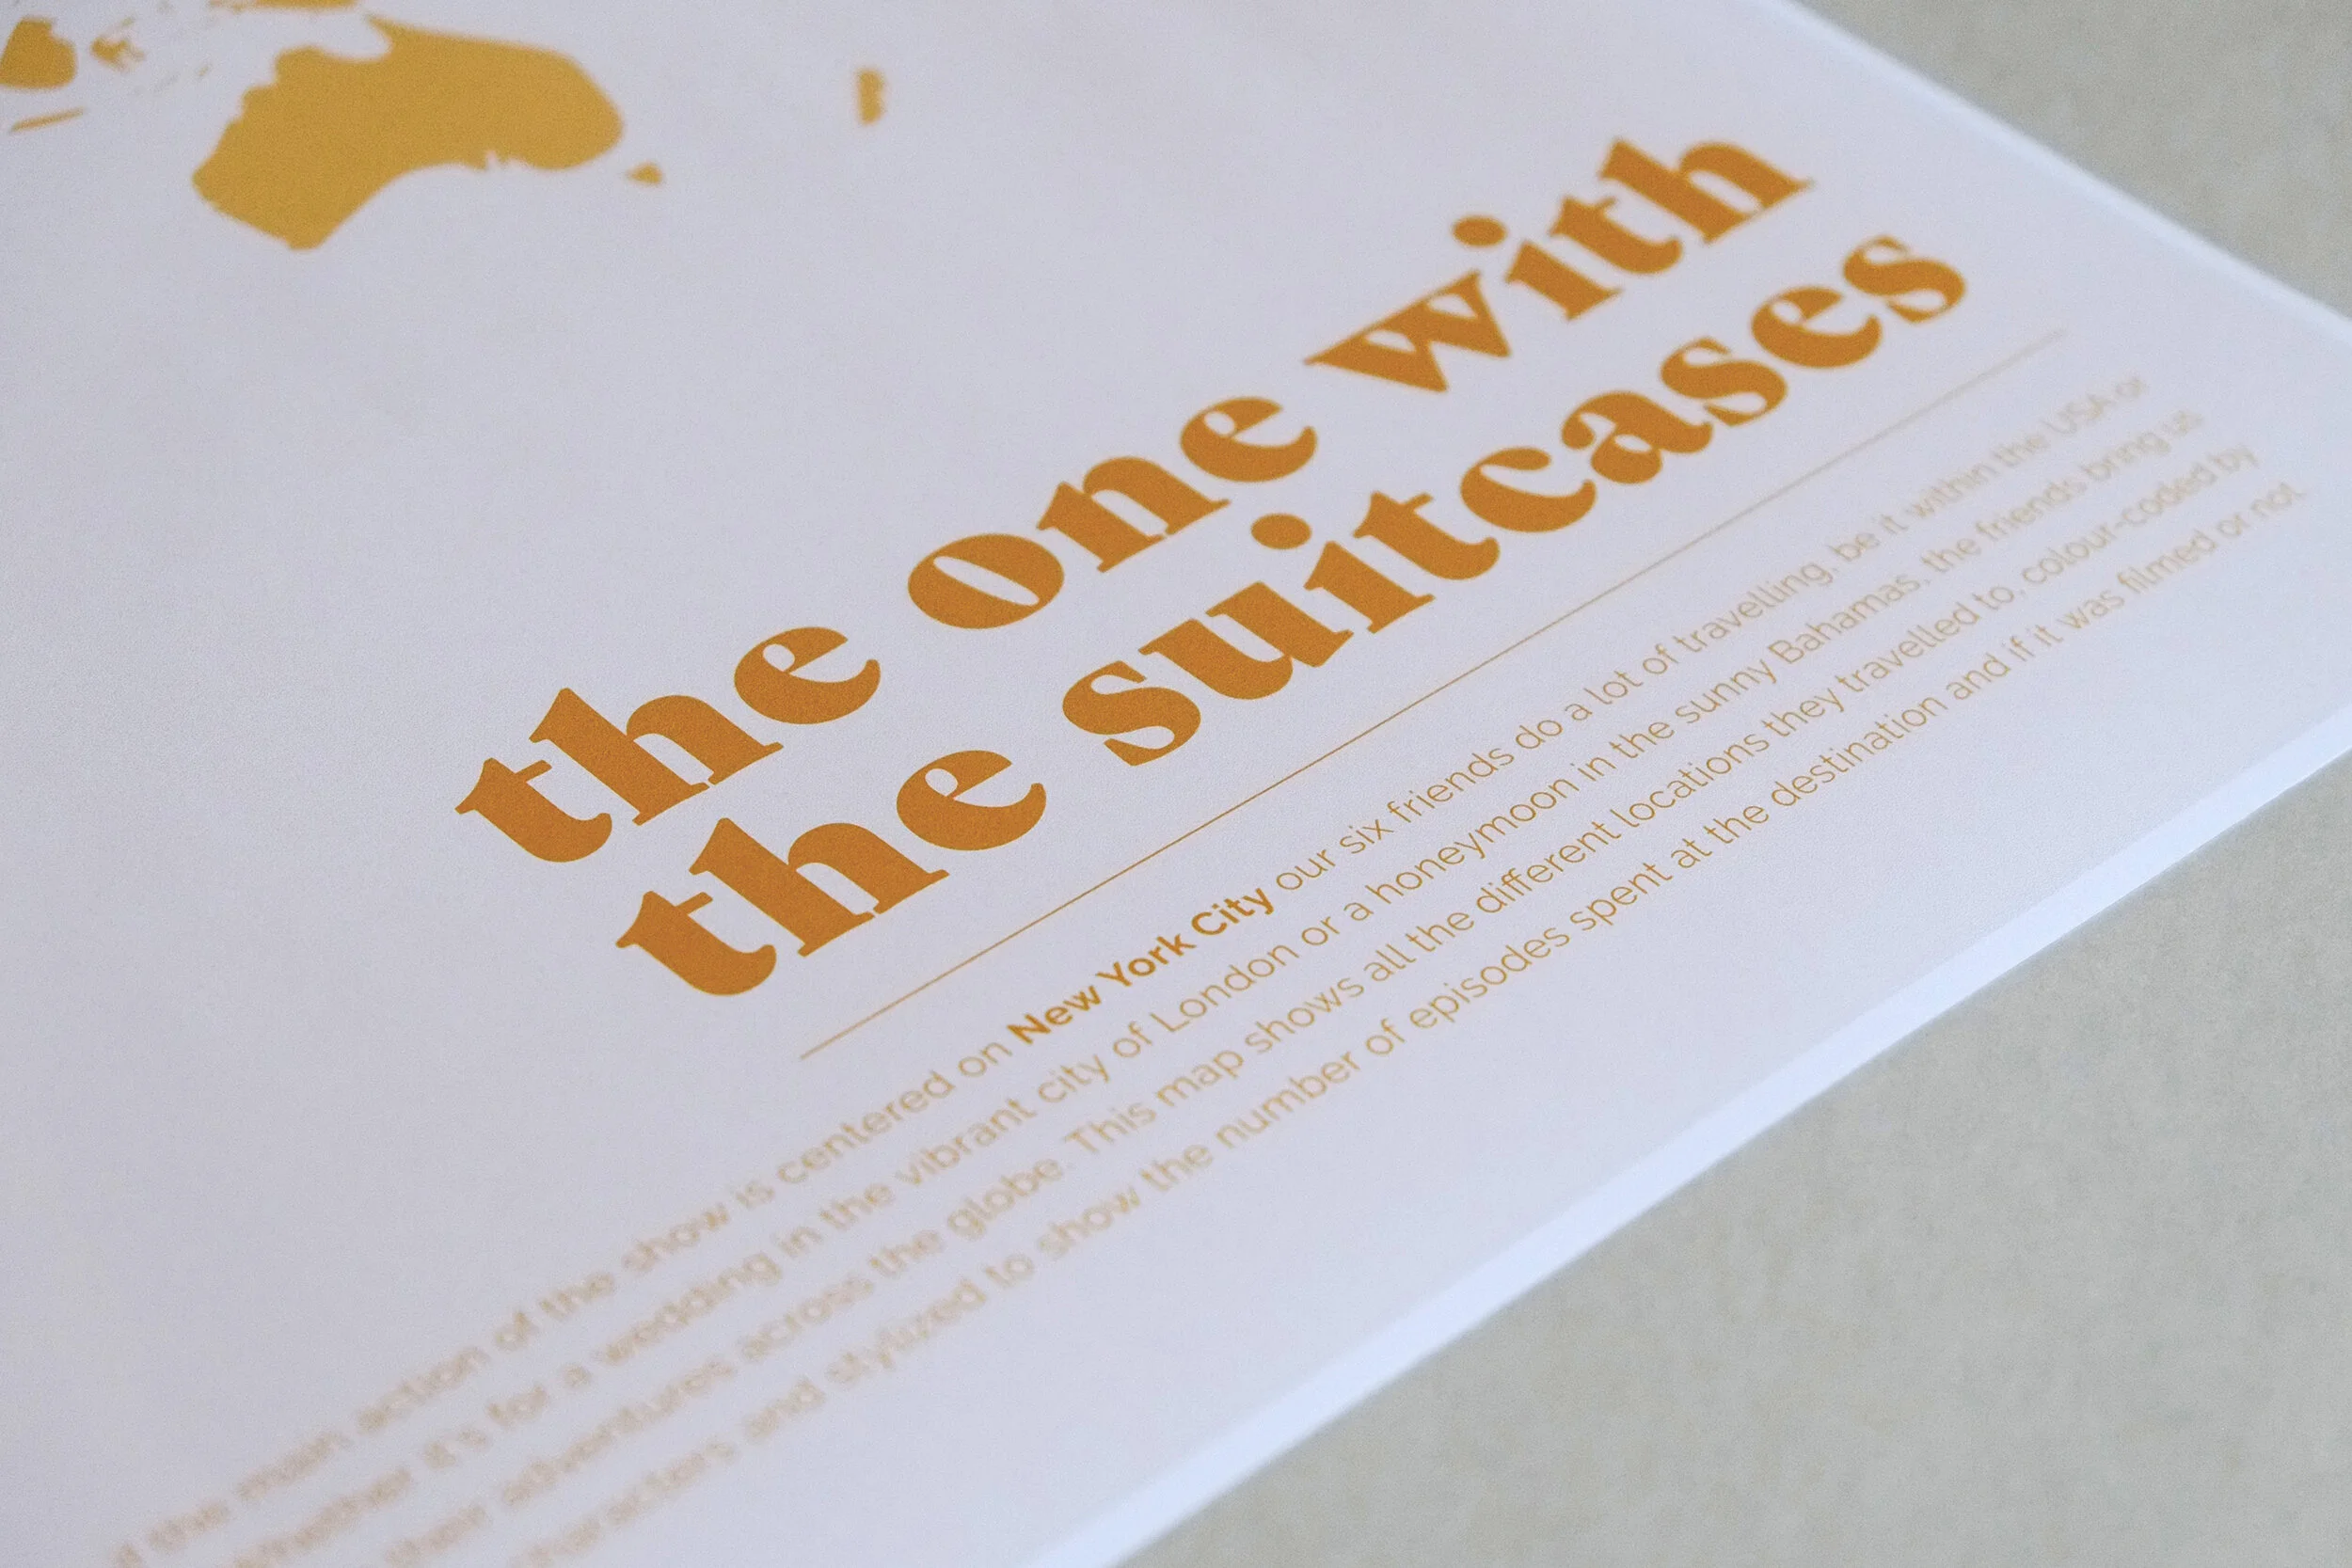
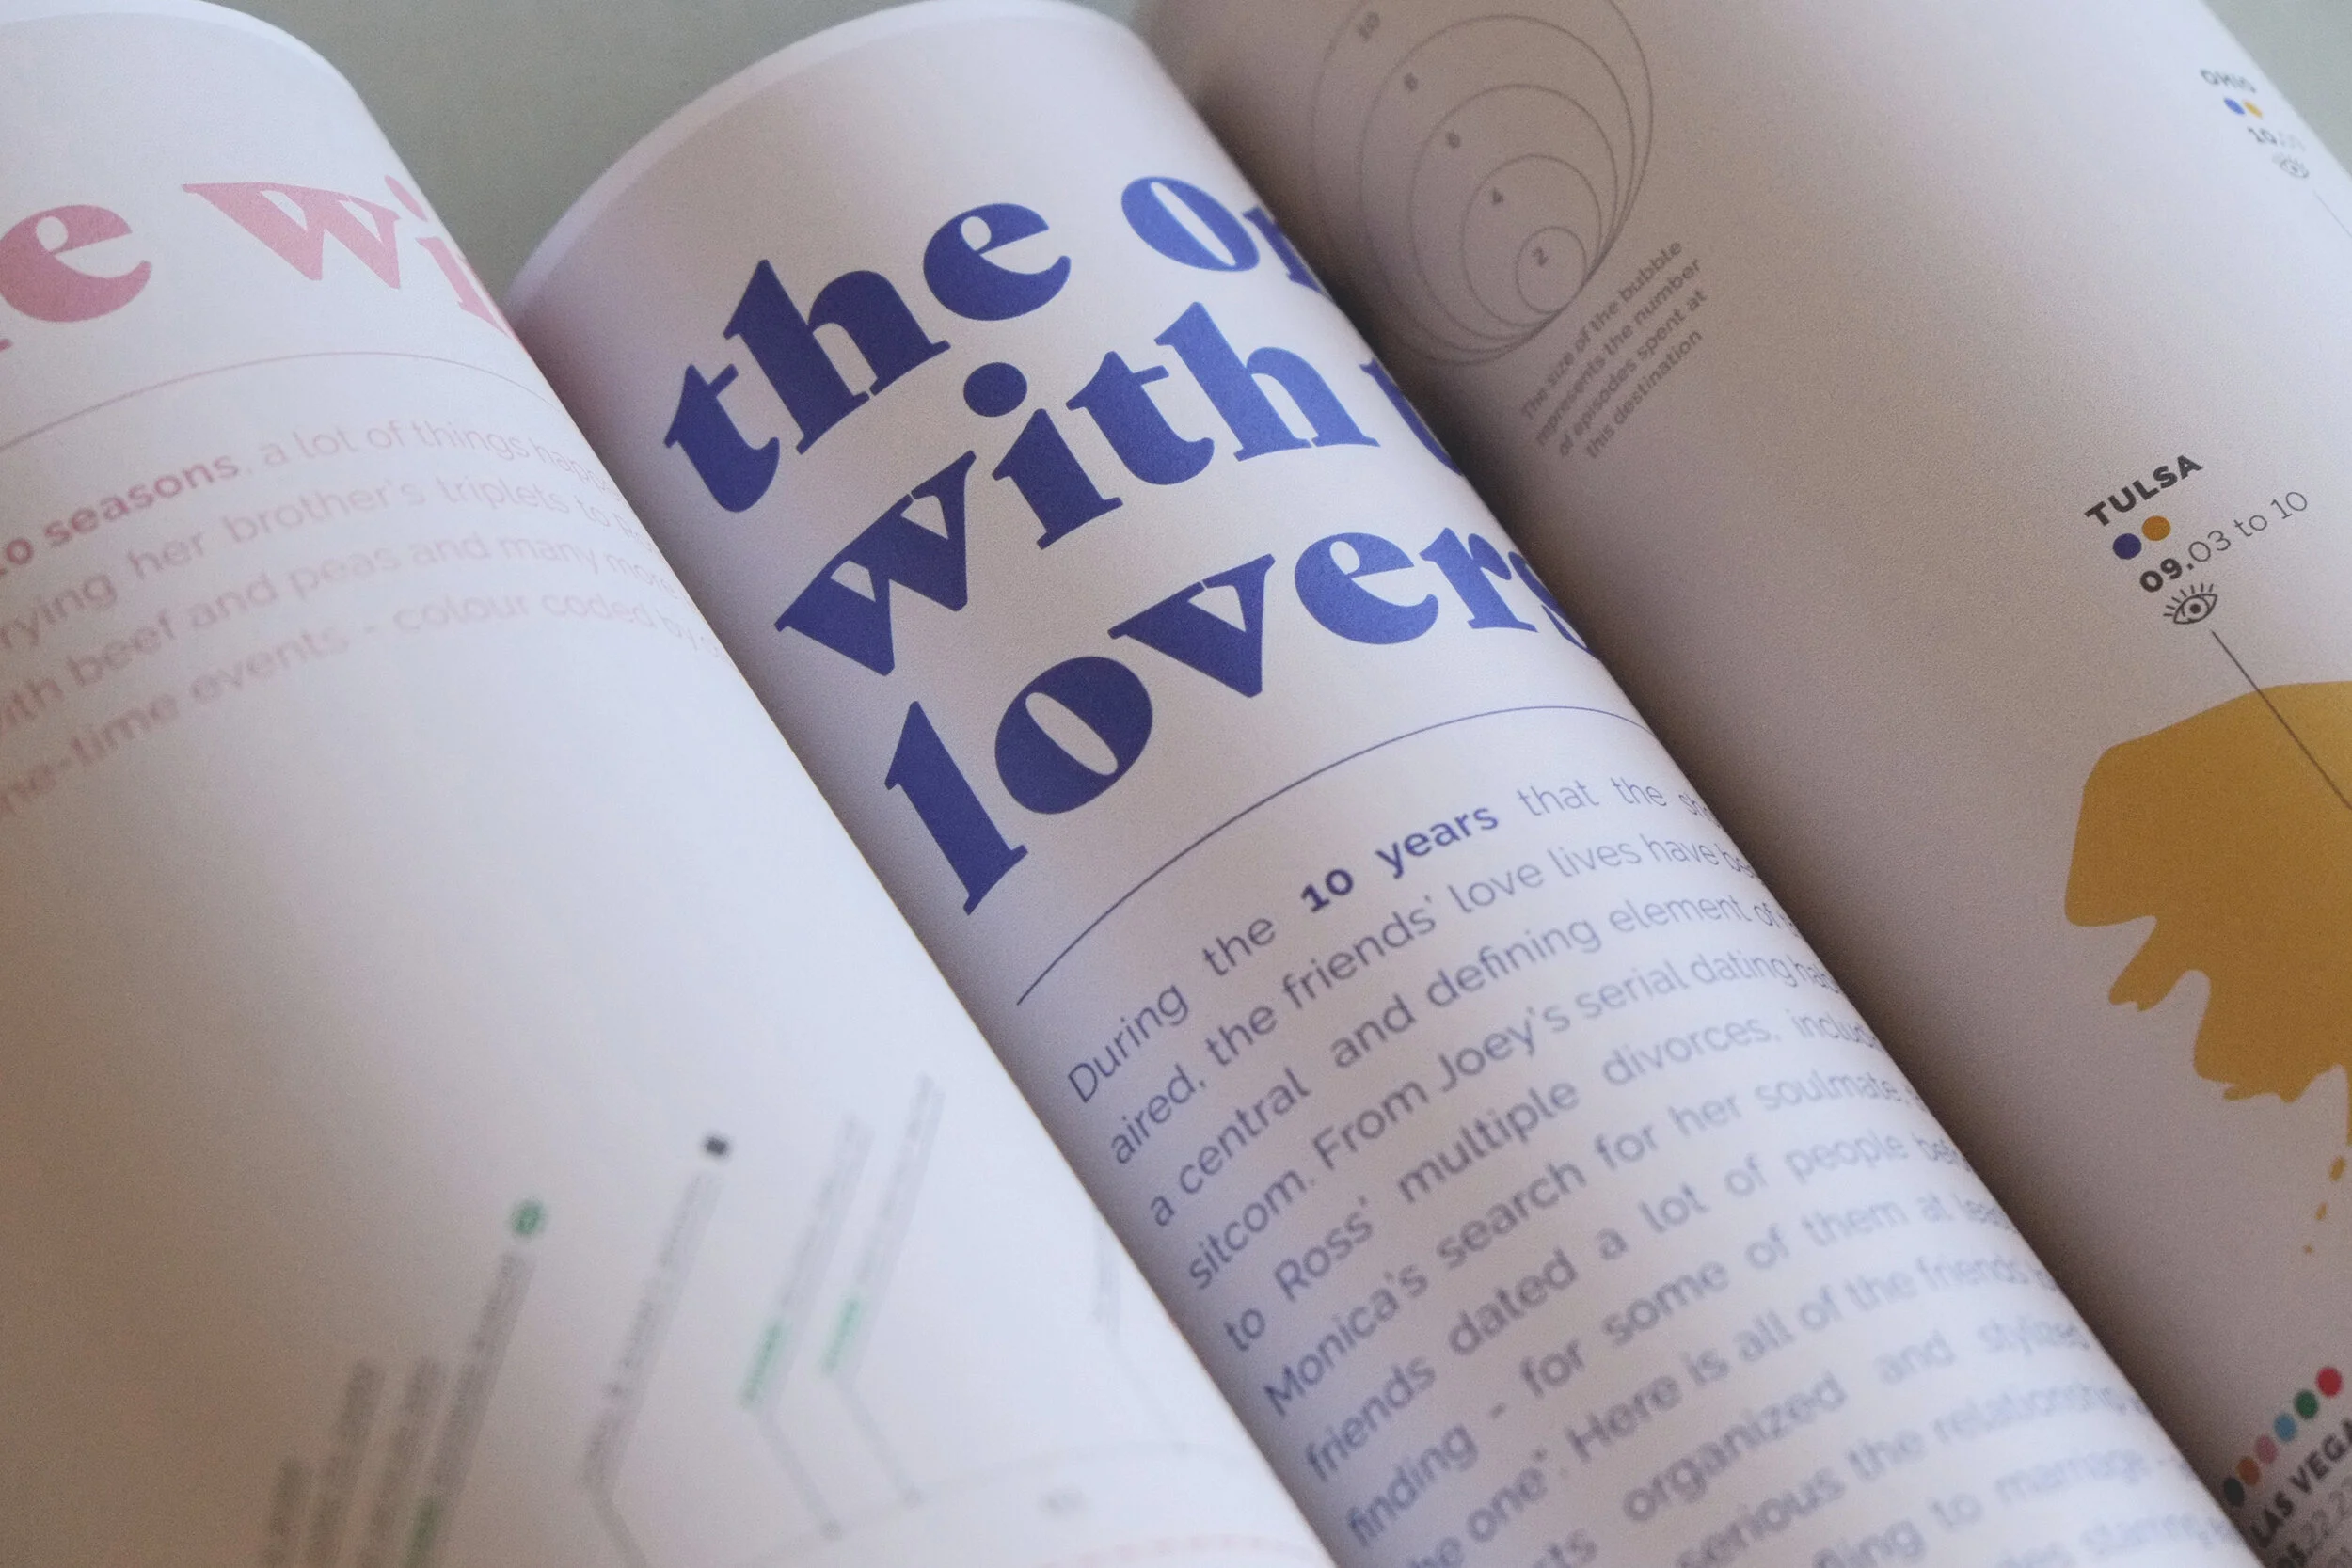
This series of infographics was born from my growing obsession with data visualisation and my longtime love for the show Friends. I collected all sorts of data from the 236 episodes, from the trips the friends took to their different love interests and the various aspects of their lives. From this data collected I created three infographic posters - each with a different topic - to help visualize the intricacies of the show and the singularities of the six main characters.